Market Outlook
September 27, 2017
Market Cues
Domestic Indices
Chg (%)
(Pts)
(Close)
Indian markets are likely to open in positive tracking global indices and SGX Nifty.
BSE Sensex
(0.1)
(27)
31,600
U.S. stock-market indexes relinquished earlier gains to close little changed on
Nifty
(0.0)
(1)
9,872
Tuesday. Investors appeared to shrug off comments from Federal Reserve
Mid Cap
0.4
68
15,500
Chairwoman Janet Yellen, who cautioned against moving too slowly on interest
rates. Yellen said there is a risk that the labor market could become overheated,
Small Cap
1.1
173
16,136
causing an inflation problem down the road. The Dow dipped 0.1 % to 22,284,
Bankex
0.2
49
27,233
NASDAQ rose 0.2 % to 6,380 and the S&P 500 inched up 0.1% to 2,497.
The U.K. stocks on Tuesday closed lower for a second straight session, with analysts
Global Indices
Chg (%)
(Pts)
(Close)
saying an escalating war of words between the U.S. and North Korea helped push
Dow Jones
(0.1)
(12)
22,284
investors out of risky assets. The FTSE 100 index UKX, fell 0.2% to end at 7,286,
Nasdaq
0.2
10
6,380
building on a 0.1% loss from Monday.
FTSE
(0.2)
(16)
7,286
Indian shares fell for a sixth consecutive session on Tuesday, although markets
Nikkei
(0.4)
(73)
20,257
ended well off their day's lows, tracking a positive trend in Europe. The 30-share BSE
Hang Seng
0.5
133
27,646
Sensex finished at 31,600, down by 0.08% from its previous close, while the 50-
Shanghai Com
0.0
1
3,345
share Nifty index ended down 0.01 % at 9,872.
Advances / Declines
BSE
NSE
News Analysis
Dabur India partners with Amazon to strengthen global sales
Advances
1,562
1,077
Declines
1,988
602
Detailed analysis is on Pg2
Unchanged
165
77
Investor’s Ready Reckoner
Key Domestic & Global Indicators
Volumes (` Cr)
Stock Watch: Latest investment recommendations on 150+ stocks
BSE#
4,002
Refer Pg7 onwards
NSE
26,493
Top Picks
CMP
Target
Upside
#Net Inflows (` Cr)
Net
Mtd
Ytd
Company
Sector
Rating
(`)
(`)
(%)
FII
(56(29)
(2(4,984)
442,305
Blue Star
Capital Goods Accumulate
749
850
13.5
MFs
1,116
4,9,093
177,980
Dewan Housing FinanceFinancials
Accumulate
556
610
9.6
Asian Granito
Others
Buy
476
570
19.7
Navkar Corporation
Others
Buy
186
265
42.5
Top Gainers
Price (`)
Chg (%)
KEI Industries
Capital Goods
Buy
319
371
16.1
Edelweiss
278
9.0
More Top Picks on Pg5
Godfryphlp
1,042
7.9
Key Upcoming Events
Dhfl
556
6.0
Previous
Consensus
Date
Region
Event Description
Prestige
266
6.0
Reading
Expectations
Sep 28, 2017 Euro Zone Euro-Zone Consumer Confidence
(1.20)
(1.20)
Oil
349
5.4
Sep 28, 2017 US
Initial Jobless claims
259.00
270.00
Sep 28, 2017 US
GDP Qoq (Annualised)
3.00
3.00
Top Losers
Price (`)
Chg (%)
Sep 29, 2017 China
PMI Manufacturing
51.70
51.50
Centralbk
273
(6.3)
Sep 29, 2017 Germany Unemployment change (000's)
(5.00)
(5.00)
More Events on Pg7
Jpassociat
16
(4.1)
Recltd
161
(3.7)
Sci
94
(3.6)
Infratel
376
(3.5)
#as on 26th Sep, 2017
Market Outlook
September 27, 2017
News Analysis
Dabur India partners with Amazon to strengthen global sales
FMCG Major Dabur India Ltd will start selling its products in the US, Canada and
Mexico on Amazon’s global marketplace this quarter, the two companies said.
The partnership will help Dabur to tap into demand from the Indian as well as
local Americans. As a part of Amazon’s global seller programme, Dabur initially
will take around 30 of its products like Vatika hair oil, Chyawanprash and
toothpaste to the US market. Depending on the response, it would launch 80 more
products in the next quarter. The company is also introducing an exclusive product
Himalaya Honey that will be sold through Amazon.com. Recently, Dabur got listed
as a seller on Amazon’s India portal to sell its products in the country.
Economic and Political News
GST collections slow down in August to `90,669cr
Scope for rate cut by RBI remains, less possibility of fiscal stimulus: ADB
SEBI to allow MFs in commodity derivatives
Corporate News
TCS’ U.K.-based subsidiary Diligenta secured a 15-year deal from Scottish
Widows
Aurobindo Pharma received Form 483 with 2 observations from the U.S. FDA
TVS Motor says Jupiter scooter sales crossed two million-mark in four years
Market Outlook
September 27, 2017
Top Picks
Market Cap
CMP
Target
Upside
Company
Rationale
(` Cr)
(`)
(`)
(%)
Strong growth in domestic business due to its leadership
in acute therapeutic segment. Alkem expects to launch
Alkem Laboratories
22,486
1,881
2,079
10.5
more products in USA, which bodes for its international
business.
We expect the company would report strong profitability
Asian Granito
1,432
476
570
19.7
owing to better product mix, higher B2C sales and
amalgamation synergy.
Favorable outlook for the AC industry to augur well for
Cooling products business which is out pacing the
Blue Star
7,172
749
850
13.5
market growth. EMPPAC division's profitability to
improve once operating environment turns around.
With a focus on the low and medium income (LMI)
consumer segment, the company has increased its
Dewan Housing Finance
17,446
556
610
9.6
presence in tier-II & III cities where the growth
opportunity is immense.
Loan growth is likely to pick up after a sluggish FY17.
Lower credit cost will help in strong bottom-line growth.
Karur Vysya Bank
8,929
148
180
21.8
Increasing share of CASA will help in NIM
improvement.
High order book execution in EPC segment, rising B2C
KEI Industries
2,485
319
371
16.1
sales and higher exports to boost the revenues and
profitability
Expected to benefit from the lower capex requirement
Music Broadcast
2,218
389
434
11.7
and 15 year long radio broadcast licensing.
Massive capacity expansion along with rail advantage
Navkar Corporation
2,653
186
265
42.5
at ICD as well CFS augurs well for the company
Strong brands and distribution network would boost
Siyaram Silk Mills
2,018
2,152
2,500
16.2
growth going ahead. Stock currently trades at an
inexpensive valuation.
Market leadership in Hindi news genre and no.
2
viewership ranking in English news genre, exit from the
TV Today Network
2,225
373
435
16.6
radio business, and anticipated growth in ad spends by
corporates to benefit the stock.
After GST, the company is expected to see higher
volumes along with improving product mix. The Gujarat
Maruti Suzuki
2,38,207
7,886
8,658
9.8
plant will also enable higher operating leverage which
will be margin accretive.
We expect loan book to grow at 24.3% over next two
GIC Housing
2,780
516
655
26.9
year; change in borrowing mix will help in NIM
improvement..
Source: Company, Angel Research
Market Outlook
September 27, 2017
Key Upcoming Events
Global economic events release calendar
Bl oomberg Data
D ate
Time
C ountry
Event Description
Unit
Period
L ast Reporte d
E stimate d
Sep 28, 2017
2:30 PM Euro Zone
Euro-Zone Consumer Confidence
Value
Sep F
(1.20)
(1.20)
6:00 PM US
Initial Jobless claims
Thousands
Sep 23
259.00
270.00
6:00 PM US
GDP Qoq (Annualise d)
% Change
2Q T
3.00
3.00
Sep 29, 2017
6:30 AM China
PMI Manufacturing
Value
Sep
51.70
51.50
1:25 PM Germany
Unempl oyment change (000's)
Thousands
Sep
(5.00)
(5.00)
Sep 30, 2017
2:00 PM UK
GDP (YoY)
% Change
2Q F
1.70
1.70
Oct 02, 2017
1:25 PM Germany
PMI Manufacturing
Value
Sep F
60.60
2:00 PM UK
PMI Manufacturing
Value
Sep
56.90
Oct 04, 2017
1:25 PM Germany
PMI Services
Value
Sep F
55.60
2:30 PM India
RBI Reverse Re po rate
%
Oct 4
5.75
2:30 PM India
RBI Repo rate
%
Oct 4
6.00
2:30 PM India
RBI Cash Reserve ratio
%
Oct 4
4.00
Oct 06, 2017
6:00 PM US
Change in N onfarm payrolls
Thousands
Sep
156.00
70.00
6:00 PM US
Unnemployment rate
%
Sep
4.40
4.40
Oct 10, 2017
India
Imports YoY%
% Change
Sep
21.00
2:00 PM UK
Industrial Production (YoY)
% Change
Aug
0.40
India
Exports YoY%
% Change
Sep
10.30
Oct 12, 2017
US
Producer Price Index (mom)
% Change
Sep
0.50
5:30 PM India
Industrial Production YoY
% Change
Aug
1.20
Oct 13, 2017
6:00 PM US
Consumer price index (mom)
% Change
Sep
0.40
0.50
China
Exports YoY%
% Change
Sep
5.60
Oct 16, 2017
12: 00 PM India
Monthly Wholesale Prices YoY%
% Change
Sep
3.24
7:00 AM China
Consumer Price Index (YoY)
% Change
Sep
1.80
Oct 17, 2017
2:30 PM Euro Zone
Euro-Zone CPI (YoY)
%
Sep F
1.50
Source: Bloomberg, Angel Research
Market Outlook
September 27, 2017
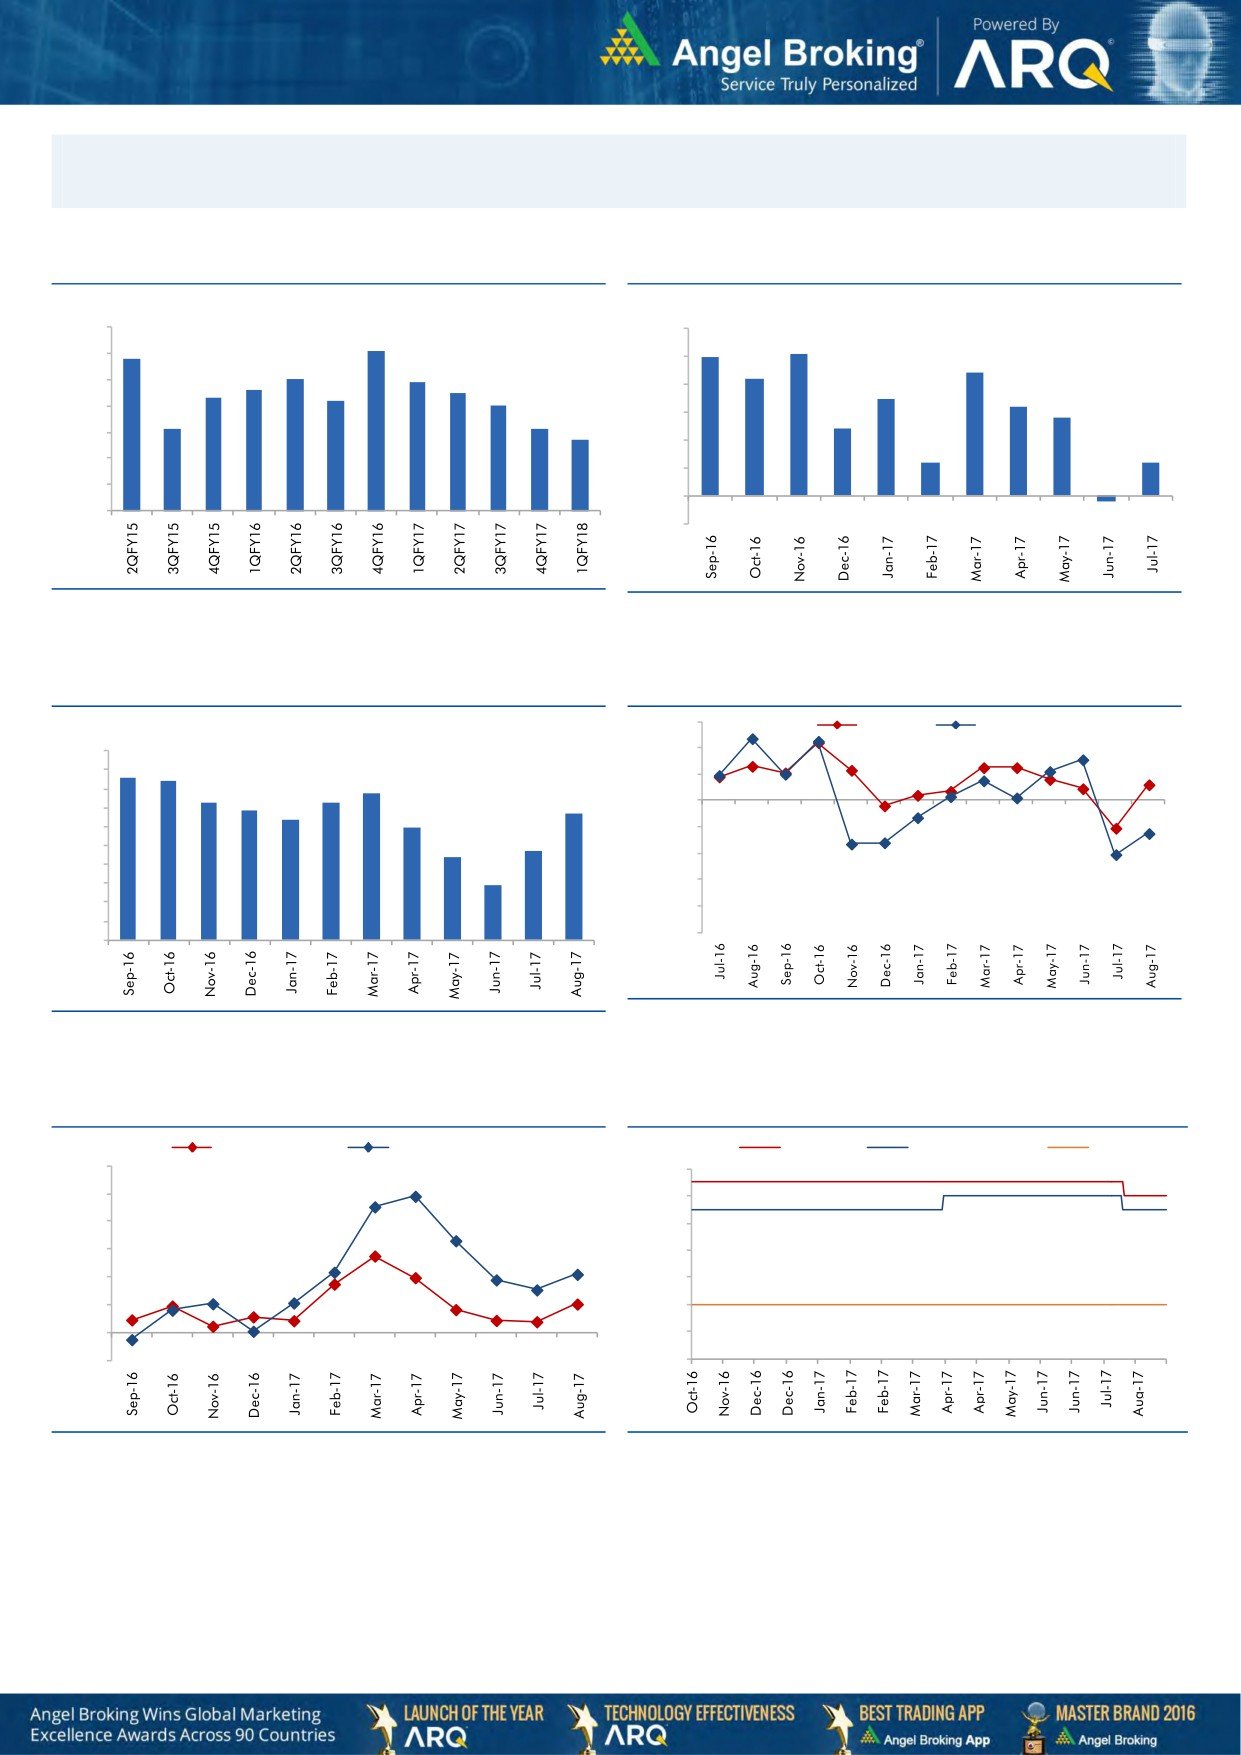
Macro watch
Exhibit 1: Quarterly GDP trends
Exhibit 2: IIP trends
(%)
(%)
10.0
6.0
9.1
5.1
8.8
5.0
9.0
5.0
4.4
8.0
7.9
4.2
7.6
7.5
8.0
7.3
7.2
4.0
3.5
7.0
3.2
2.8
7.0
6.1
6.1
3.0
2.4
5.7
6.0
2.0
1.2
1.2
5.0
1.0
4.0
-
3.0
(1.0)
(0.2)
Source: CSO, Angel Research
Source: MOSPI, Angel Research
Exhibit 3: Monthly CPI inflation trends
Exhibit 4: Manufacturing and services PMI
56.0
Mfg. PMI
Services PMI
(%)
5.0
54.0
4.3
4.2
4.5
3.9
52.0
4.0
3.6
3.7
3.4
3.4
3.2
50.0
3.5
3.0
3.0
48.0
2.4
2.2
2.5
46.0
2.0
1.5
1.5
44.0
1.0
42.0
0.5
40.0
-
Source: Market, Angel Research; Note: Level above 50 indicates expansion
Source: MOSPI, Angel Research
Exhibit 5: Exports and imports growth trends
Exhibit 6: Key policy rates
(%)
Exports yoy growth
Imports yoy growth
(%)
Repo rate
Reverse Repo rate
CRR
60.0
6.50
50.0
6.00
40.0
5.50
30.0
5.00
20.0
4.50
10.0
4.00
0.0
3.50
(10.0)
3.00
Source: Bloomberg, Angel Research
Source: RBI, Angel Research
Market Outlook
September 27, 2017
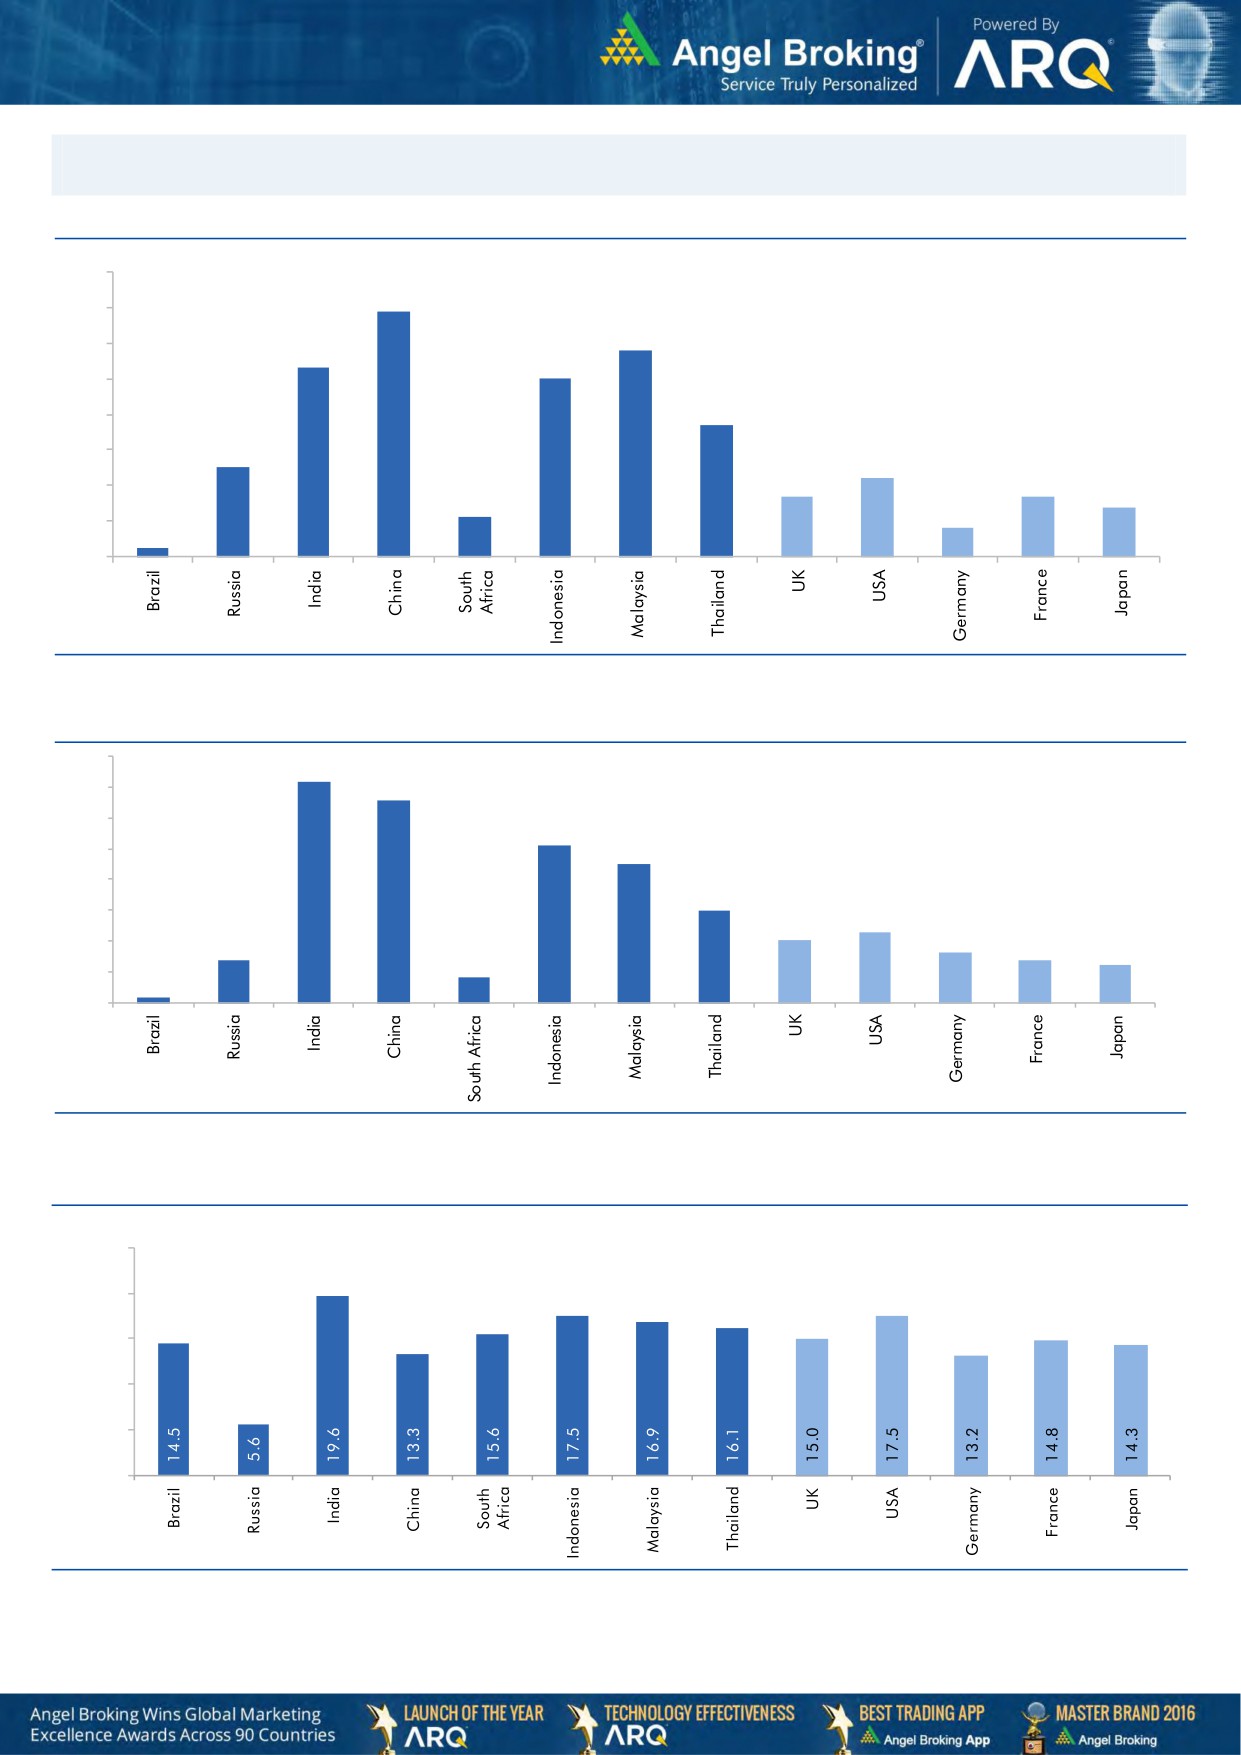
Global watch
Exhibit 1: Latest quarterly GDP Growth (%, yoy) across select developing and developed countries
(%)
8.0
6.9
7.0
5.8
6.0
5.3
5.0
5.0
1.1
3.7
4.0
2.5
3.0
2.2
1.7
1.7
2.0
1.4
0.8
1.0
0.3
-
Source: Bloomberg, Angel Research
Exhibit 2: 2017 GDP Growth projection by IMF (%, yoy) across select developing and developed countries
(%)
7.2
6.6
7.0
6.0
5.1
5.0
4.5
4.0
3.0
3.0
2.3
2.0
1.4
1.6
2.0
1.4
1.2
0.2
0.8
1.0
-
Source: IMF, Angel Research
Exhibit 3: One year forward P-E ratio across select developing and developed countries
(x)
25.0
20.0
15.0
10.0
5.0
-
Source: IMF, Angel Research, data as of 26th Sept-17
Market Outlook
September 27, 2017
Exhibit 4: Relative performance of indices across globe
Returns (%)
C ountry
Name of index
Closing price
1M
3M
1YR
Brazil
Bovespa
74,319
4.5
20.5
26.0
Russia
Micex
2,071
4.6
9.5
4.6
India
Nifty
9,872
0.1
3.1
11.3
China
Shanghai Composite
3,344
(0.5)
4.9
10.5
South Africa
Top 40
48,819
(2.6)
8.2
7.8
Mexico
Mexbol
50,359
(2.0)
2.1
4.8
Indonesia
LQ45
976
(0.9)
1.4
7.5
Malaysia
KLCI
1,766
(0.3)
(0.8)
6.8
Thailand
SET 50
1,069
6.6
7.3
13.9
USA
Dow Jones
22,284
2.3
4.1
22.3
UK
FTSE
7,286
(1.6)
(2.0)
6.4
Japan
Nikkei
20,330
5.0
1.0
23.1
Germany
DAX
12,605
3.6
(0.3)
19.9
France
CAC
5,269
3.2
0.3
17.0
Source: Bloomberg, Angel Research, data as of 26th Sept-17 p68in4
Stock Watch
September 27, 2017
Company Name
Reco
CMP
Target
Mkt Cap
Sales ( Čcr )
OPM(%)
EPS (Č)
PER(x)
P/BV(x)
RoE(%)
EV/Sales(x)
(Č)
Price ( Č)
( Č cr )
FY18E FY19E
FY18E
FY19E
FY18E
FY19E
FY18E
FY19E
FY18E
FY19E
FY18E
FY19E
FY18E
FY19E
Agri / Agri Chemical
Rallis
Neutral
214
-
4,155
1,873
2,099
15.0
15.0
9.5
10.5
22.5
20.4
3.4
3.1
15.8
16.0
2.1
1.9
United Phosphorus
Accumulate
780
820
39,607
18,922
21,949
18.0
18.5
36.2
45.6
21.5
17.1
4.5
3.7
22.7
23.8
2.3
1.9
Auto & Auto Ancillary
Ashok Leyland
Accumulate
114
127
33,289
23,339
27,240
10.1
10.8
4.7
6.2
24.5
18.3
4.9
4.3
20.0
23.6
1.4
1.2
Bajaj Auto
Neutral
3,036
-
87,863
23,936
27,955
19.5
20.1
142.7
167.3
21.3
18.1
4.6
4.1
21.8
22.8
3.3
2.7
Bharat Forge
Neutral
1,274
-
29,664
7,637
8,755
21.7
23.2
36.1
47.3
35.3
27.0
6.3
5.4
18.5
20.8
3.7
3.2
Eicher Motors
Neutral
30,827
-
83,920
19,043
22,837
19.5
19.9
835.4
1,019.0
36.9
30.3
13.8
10.6
40.9
37.8
4.3
3.5
Gabriel India
Neutral
203
-
2,910
1,782
2,033
9.7
10.2
7.1
8.9
28.5
22.9
5.8
4.9
21.0
22.2
1.6
1.4
Hero Motocorp
Accumulate
3,786
4,129
75,602
32,239
36,878
16.0
15.6
184.4
206.5
20.5
18.3
6.5
5.7
31.3
30.7
2.1
1.8
Jamna Auto Industries Neutral
252
-
2,004
1,441
1,662
14.4
14.8
13.9
17.6
18.1
14.3
4.9
4.0
30.0
31.0
1.4
1.2
Mahindra and Mahindra Neutral
1,246
-
77,391
46,971
53,816
13.6
14.0
67.7
79.8
18.4
15.6
2.6
2.3
15.0
15.9
1.5
1.3
Maruti
Accumulate
7,886
8,658
238,207
81,825
101,245
15.0
15.0
283.5
356.0
27.8
22.2
6.1
5.0
21.9
22.4
2.6
2.0
Minda Industries
Neutral
843
-
7,283
4,328
5,084
11.0
11.9
27.3
36.4
30.9
23.2
6.6
5.1
23.1
25.6
1.8
1.5
Motherson Sumi
Neutral
339
-
71,439
55,937
64,445
10.8
11.4
16.9
21.1
20.1
16.1
4.5
4.6
25.2
25.4
1.3
1.1
Tata Motors
Neutral
411
-
118,641
303,167
343,649
11.8
13.8
33.1
54.7
12.4
7.5
2.0
1.6
16.9
23.0
0.4
0.4
TVS Motor
Neutral
648
-
30,779
13,992
16,216
9.0
9.4
17.1
20.3
38.0
31.9
10.1
7.8
29.7
27.7
2.1
1.8
Amara Raja Batteries
Buy
725
858
12,386
6,140
7,122
14.3
15.6
29.3
39.0
24.8
18.6
4.2
3.5
17.1
19.0
2.0
1.7
Exide Industries
Neutral
206
-
17,480
8,689
9,854
15.1
15.2
9.7
11.0
21.3
18.7
3.8
3.3
15.7
16.1
1.7
1.5
Apollo Tyres
Neutral
248
-
12,624
15,739
17,326
13.3
14.6
20.4
26.7
12.2
9.3
1.5
1.3
20.4
26.7
1.0
0.9
Ceat
Neutral
1,675
-
6,777
6,661
7,717
11.1
14.2
116.2
178.2
14.4
9.4
2.5
2.1
15.2
21.3
1.1
1.0
JK Tyres
Neutral
149
-
3,369
8,318
9,239
16.2
16.4
21.0
27.5
7.1
5.4
1.4
1.1
19.1
20.4
0.9
0.7
Swaraj Engines
Neutral
2,065
-
2,565
788
889
16.4
16.5
71.6
81.0
28.8
25.5
8.3
7.7
29.6
31.0
2.9
2.5
Subros
Neutral
221
-
1,326
1,855
2,135
11.6
11.8
10.3
14.7
21.6
15.1
3.3
2.8
15.8
19.1
0.9
0.8
Capital Goods
BEML
Neutral
1,686
-
7,021
4,286
5,194
7.1
8.2
42.9
58.1
39.3
29.0
3.2
2.9
7.6
8.7
1.7
1.4
Bharat Electronics
Neutral
183
-
40,775
10,258
12,470
19.6
19.5
7.3
8.6
25.0
21.2
0.5
0.4
20.4
21.9
3.5
2.8
Voltas
Neutral
519
-
17,158
6,778
8,004
9.6
11.0
17.1
22.4
30.3
23.2
7.2
6.3
17.7
19.8
2.2
1.9
BHEL
Neutral
128
-
31,219
33,200
39,167
6.8
9.5
6.2
11.2
20.6
11.4
0.9
0.9
4.6
8.0
0.5
0.4
Blue Star
Accumulate
749
850
7,172
5,220
6,207
6.3
6.6
16.8
22.3
44.6
33.6
8.9
7.8
19.9
23.3
1.3
1.1
CG Power and Industrial
Neutral
78
-
4,876
6,555
7,292
7.5
7.5
-
0.8
7,780.0
97.3
1.2
1.2
0.1
1.2
0.8
0.8
Solutions
Greaves Cotton
Neutral
136
-
3,329
1,778
1,993
14.7
15.1
8.1
9.1
16.8
15.0
3.8
3.5
21.8
23.6
1.6
1.5
Stock Watch
September 27, 2017
Company Name
Reco
CMP
Target
Mkt Cap
Sales ( Čcr )
OPM(%)
EPS (Č)
PER(x)
P/BV(x)
RoE(%)
EV/Sales(x)
(Č)
Price ( Č)
( Č cr )
FY18E FY19E
FY18E
FY19E
FY18E
FY19E
FY18E
FY19E
FY18E
FY19E
FY18E
FY19E
FY18E
FY19E
Capital Goods
KEC International
Accumulate
309
350
7,954
9,779
11,113
9.4
9.8
14.2
18.2
21.8
17.0
4.2
3.4
21.1
22.1
1.1
0.9
KEI Industries
Buy
319
371
2,485
3,001
3,391
10.0
10.0
13.0
16.1
24.6
19.8
4.5
3.7
18.2
18.7
1.0
0.9
Thermax
Neutral
875
-
10,426
4,125
4,747
10.3
10.8
26.7
31.5
32.8
27.8
3.7
3.4
11.2
12.0
2.3
2.0
VATech Wabag
Accumulate
609
681
3,323
3,867
4,126
9.6
10.0
34.9
39.8
17.4
15.3
2.9
2.5
17.7
17.5
0.9
0.8
Cement
ACC
Neutral
1,632
-
30,652
12,255
13,350
13.5
14.3
58.0
66.2
28.1
24.7
3.3
3.1
11.5
12.2
2.5
2.3
Ambuja Cements
Neutral
261
-
51,815
10,250
11,450
17.5
19.0
7.2
8.3
36.2
31.4
2.6
2.5
7.0
7.8
4.8
4.3
India Cements
Neutral
171
-
5,279
6,135
6,750
14.8
15.2
8.5
11.5
20.2
14.9
1.0
1.0
4.8
6.2
1.2
1.1
JK Cement
Neutral
956
-
6,686
4,150
4,775
19.2
20.0
49.0
63.5
19.5
15.1
3.1
2.7
17.0
18.5
2.0
1.7
J K Lakshmi Cement
Neutral
389
-
4,572
3,422
3,757
15.5
17.0
13.5
23.2
28.8
16.8
3.0
2.6
10.8
15.5
1.7
1.5
Orient Cement
Neutral
153
-
3,137
2,215
3,233
16.8
17.0
5.9
6.9
26.0
22.2
2.0
1.8
10.8
10.1
2.4
1.6
UltraTech Cement
Neutral
3,914
-
107,454
28,250
35,150
20.2
23.5
77.5
122.2
50.5
32.0
4.3
3.9
9.6
14.8
4.3
3.4
Construction
KNR Constructions
Neutral
208
-
2,922
1,846
2,203
14.5
14.5
12.1
13.7
17.2
15.2
0.9
0.8
17.5
16.7
1.6
1.4
Larsen & Toubro
Neutral
1,160
-
162,442
95,787
109,476
10.2
11.6
44.5
50.8
26.1
22.9
3.3
3.0
12.9
13.1
2.2
2.0
Gujarat Pipavav Port
Neutral
135
-
6,541
739
842
61.6
62.7
5.1
6.2
26.5
22.0
3.3
3.2
12.7
14.9
8.3
7.2
PNC Infratech
Accumulate
136
143
3,484
2,040
2,935
13.0
13.0
6.4
9.0
21.2
15.1
0.6
0.5
9.7
12.2
1.7
1.2
Simplex Infra
Neutral
456
-
2,254
6,012
6,619
11.6
11.7
21.1
31.0
21.7
14.7
1.5
1.4
6.5
8.6
0.9
0.8
Sadbhav Engineering
Neutral
293
-
5,027
3,823
4,426
10.7
10.8
10.3
11.8
28.5
24.8
3.4
3.0
10.1
10.5
1.6
1.4
NBCC
Neutral
212
-
19,116
9,099
12,706
6.4
6.4
7.3
9.6
29.2
22.2
1.3
1.0
27.5
30.5
2.0
1.4
MEP Infra
Neutral
99
-
1,612
2,403
2,910
18.3
16.8
2.4
6.1
42.2
16.3
16.0
10.8
35.2
55.8
1.8
1.5
SIPL
Neutral
93
-
3,279
2,060
2,390
46.8
47.7
(5.8)
(3.1)
3.5
4.0
(14.2)
(2.3)
6.4
6.0
Engineers India
Neutral
153
-
10,317
1,795
2,611
21.1
22.4
5.9
8.1
26.0
18.9
1.9
1.8
12.9
16.1
4.1
2.7
Financials
Axis Bank
Accumulate
510
580
122,373
32,558
35,843
3.5
3.2
27.8
41.0
18.4
12.4
2.0
1.7
11.4
14.9
-
-
Bank of Baroda
Neutral
143
-
32,846
22,533
26,079
2.4
2.4
12.0
20.9
11.9
6.8
0.8
0.7
6.6
11.0
-
-
Canara Bank
Neutral
328
-
19,561
17,925
20,235
2.0
2.1
18.5
36.5
17.7
9.0
0.7
0.6
3.4
6.2
-
-
Can Fin Homes
Neutral
2,653
-
7,063
586
741
3.5
3.5
107.8
141.0
24.6
18.8
5.4
4.4
24.1
25.6
-
-
Cholamandalam Inv. &
Accumulate
1,075
1,230
16,797
2,826
3,307
6.3
6.3
53.7
64.6
20.0
16.7
3.4
2.9
18.3
18.9
-
-
Fin. Co.
Dewan Housing Finance Accumulate
556
610
17,446
2,676
3,383
2.4
2.7
37.4
49.7
14.9
11.2
2.0
1.7
13.8
16.2
-
-
Equitas Holdings
Buy
157
235
5,302
1,125
1,380
9.6
9.8
1.5
6.0
104.3
26.1
2.4
2.2
2.4
8.2
-
-
Federal Bank
Accumulate
112
125
21,837
4,896
5,930
2.8
3.1
5.4
7.6
20.9
14.8
1.8
1.6
8.5
11.0
-
-
Stock Watch
September 27, 2017
Company Name
Reco
CMP
Target
Mkt Cap
Sales ( Čcr )
OPM(%)
EPS (Č)
PER(x)
P/BV(x)
RoE(%)
EV/Sales(x)
(Č)
Price ( Č)
( Č cr )
FY18E FY19E
FY18E
FY19E
FY18E
FY19E
FY18E
FY19E
FY18E
FY19E
FY18E
FY19E
FY18E
FY19E
Financials
GIC Housing
Buy
516
655
2,780
376
477
3.6
3.7
33.0
40.0
15.7
12.9
2.8
2.4
20.0
23.0
-
-
HDFC Bank
Neutral
1,791
-
462,418
55,236
63,253
4.5
4.4
68.9
82.4
26.0
21.7
4.5
3.8
18.7
18.5
-
-
ICICI Bank
Accumulate
283
315
181,384
42,361
51,378
3.6
3.9
18.4
25.7
15.4
11.0
1.7
1.6
11.3
15.0
-
-
Karur Vysya Bank
Buy
148
180
8,929
3,289
3,630
3.7
3.9
10.8
14.1
13.6
10.5
1.6
1.5
12.5
14.7
-
-
LIC Housing Finance
Neutral
620
-
31,307
4,895
6,332
3.4
3.7
50.7
66.8
12.2
9.3
2.4
2.0
21.7
23.8
-
-
Punjab Natl.Bank
Neutral
137
-
29,143
23,708
25,758
2.1
2.1
5.9
16.4
23.3
8.3
0.7
0.7
3.0
8.3
-
-
RBL Bank
Neutral
509
-
21,010
2,309
2,888
2.6
2.5
16.4
19.1
31.1
26.7
3.9
3.5
13.3
13.8
-
-
Repco Home Finance
Buy
604
825
3,781
496
597
4.4
4.2
38.5
48.7
15.7
12.4
2.8
2.3
19.6
20.6
-
-
South Ind.Bank
Neutral
29
-
5,233
3,195
3,567
3.0
3.1
3.0
3.8
9.6
7.6
1.0
0.9
10.5
11.9
-
-
St Bk of India
Neutral
258
-
222,621
105,827
121,056
2.4
2.5
16.1
25.6
16.0
10.1
1.3
1.1
6.6
9.9
-
-
Union Bank
Neutral
131
-
9,498
14,650
16,225
2.3
2.3
23.1
32.5
5.7
4.0
0.4
0.4
7.1
9.2
-
-
Yes Bank
Neutral
360
-
82,525
11,088
13,138
3.0
2.9
84.0
99.3
4.3
3.6
0.7
0.6
16.3
16.8
-
-
FMCG
Akzo Nobel India
Neutral
1,791
-
8,592
3,164
3,607
13.8
13.7
58.6
67.9
30.6
26.4
7.5
6.6
24.5
25.1
2.6
2.2
Asian Paints
Neutral
1,172
-
112,437
17,603
20,615
18.6
18.6
2,128.9
2,543.3
0.6
0.5
11.6
9.8
28.0
28.9
6.2
5.2
Britannia
Neutral
4,330
-
51,983
9,690
11,278
14.8
15.4
84.0
101.0
51.5
42.9
18.8
14.9
40.6
39.0
5.3
4.6
Colgate
Neutral
1,081
-
29,392
4,420
5,074
24.9
25.3
28.6
32.8
37.8
33.0
14.9
12.0
43.8
40.5
6.4
5.5
Dabur India
Neutral
308
-
54,272
8,346
9,344
19.6
19.9
7.8
9.0
39.5
34.2
8.0
7.2
25.2
24.8
6.1
5.4
GlaxoSmith Con*
Neutral
4,918
-
20,685
5,072
5,760
18.2
18.4
176.3
199.2
27.9
24.7
5.9
5.4
21.2
21.7
3.4
2.9
Godrej Consumer
Neutral
914
-
62,277
10,171
11,682
20.8
21.5
21.7
27.1
42.1
33.7
9.5
8.1
22.3
23.4
6.2
5.4
HUL
Neutral
1,218
-
263,536
37,077
41,508
20.3
21.8
5,189.9
6,318.5
0.2
0.2
37.1
31.7
74.8
82.0
7.0
6.2
ITC
Neutral
262
-
319,246
44,588
49,853
37.0
37.3
9.6
11.0
27.3
23.8
6.7
6.4
25.1
27.3
6.6
5.9
Marico
Neutral
317
-
40,940
6,788
7,766
18.5
19.2
7.1
8.5
44.7
37.3
15.6
13.4
36.9
38.0
5.9
5.1
Nestle*
Neutral
7,072
-
68,187
10,083
11,182
20.0
20.9
119.7
141.3
59.1
50.1
208.2
190.3
36.7
39.8
6.4
5.8
Tata Global
Neutral
205
-
12,919
7,121
7,641
11.9
12.3
6.9
8.0
29.7
25.6
2.0
1.9
6.8
7.2
1.6
1.5
Procter & Gamble
Neutral
8,300
-
26,942
3,034
3,579
27.1
27.7
167.7
198.8
49.5
41.8
13.3
11.4
28.8
29.5
8.3
6.9
Hygiene
IT
HCL Tech^
Buy
873
1,014
124,597
52,342
57,053
20.9
20.9
62.8
67.6
13.9
12.9
3.1
2.7
22.4
20.6
2.1
1.8
Infosys
Buy
906
1,179
208,209
73,963
80,619
26.0
26.0
64.4
69.3
14.1
13.1
2.8
2.6
19.7
19.6
2.2
2.0
TCS
Accumulate
2,475
2,651
487,661
127,403
138,870
27.6
27.6
144.5
156.0
17.1
15.9
5.1
4.7
29.7
29.8
3.5
3.1
Tech Mahindra
Buy
446
533
43,520
31,015
33,496
15.0
15.0
35.6
38.1
12.5
11.7
2.1
2.0
17.0
16.3
1.2
1.0
Stock Watch
September 27, 2017
Company Name
Reco
CMP
Target
Mkt Cap
Sales ( Čcr )
OPM(%)
EPS (Č)
PER(x)
P/BV(x)
RoE(%)
EV/Sales(x)
(Č)
Price ( Č)
( Č cr )
FY18E FY19E
FY18E
FY19E
FY18E
FY19E
FY18E
FY19E
FY18E
FY19E
FY18E
FY19E
FY18E
FY19E
IT
Wipro
Neutral
290
-
141,256
58,536
61,858
20.3
20.3
18.2
19.1
16.0
15.2
2.5
2.2
14.6
13.4
2.3
2.2
Media
D B Corp
Neutral
372
-
6,841
2,404
2,625
30.5
31.5
23.7
26.9
15.7
13.8
3.7
3.2
23.5
22.8
2.7
2.4
HT Media
Neutral
95
-
2,213
2,589
2,830
15.1
15.4
8.3
10.9
11.5
8.7
0.9
0.8
8.4
10.4
0.4
0.3
Jagran Prakashan
Buy
176
225
5,749
2,541
2,835
28.5
28.7
12.7
14.1
13.9
12.5
2.9
2.5
21.3
21.4
2.1
1.8
Sun TV Network
Neutral
771
-
30,400
3,238
3,789
51.9
55.1
30.9
38.0
25.0
20.3
7.1
6.3
30.0
31.0
8.9
7.5
Hindustan Media
Neutral
260
-
1,908
1,002
1,074
23.3
23.5
29.2
33.8
8.9
7.7
1.4
1.2
15.6
15.4
0.9
0.6
Ventures
TV Today Network
Buy
373
435
2,225
667
727
27.7
27.7
18.6
20.1
20.1
18.6
3.1
3.2
15.6
17.3
2.9
2.7
Music Broadcast Limited Accumulate
389
434
2,218
271
317
91.0
109.0
6.0
10.0
64.8
38.9
4.0
3.7
6.5
9.3
7.8
6.4
Metals & Mining
Coal India
Neutral
260
-
161,579
82,301
91,235
17.0
18.0
17.1
20.5
15.2
12.7
2.9
2.7
45.0
55.0
1.6
1.5
Hind. Zinc
Neutral
300
-
126,612
22,108
24,555
57.0
58.0
22.1
26.3
13.6
11.4
4.4
3.6
32.0
35.0
4.7
3.9
Hindalco
Neutral
234
-
52,601
102,350
105,355
13.5
14.5
21.5
24.5
10.9
9.6
1.5
1.3
15.0
15.2
1.1
1.0
JSW Steel
Neutral
242
-
58,569
64,500
68,245
21.1
21.5
20.1
21.2
12.1
11.4
2.2
1.9
-
-
1.6
1.6
NMDC
Neutral
123
-
38,932
10,209
11,450
47.0
48.0
11.1
12.1
11.1
10.2
1.5
1.5
-
-
3.3
3.0
SAIL
Neutral
57
-
23,418
54,100
63,555
3.0
10.0
(10.0)
1.5
37.8
0.8
0.8
-
-
1.4
1.2
Vedanta
Neutral
318
-
118,300
81,206
87,345
28.0
29.0
26.5
33.5
12.0
9.5
2.7
2.3
-
-
2.2
1.9
Tata Steel
Neutral
654
-
63,532
121,445
126,500
16.2
17.2
65.4
81.3
10.0
8.1
1.6
1.4
-
-
1.0
0.9
Oil & Gas
GAIL
Neutral
398
-
67,246
53,115
52,344
14.2
15.3
30.0
31.1
13.3
12.8
1.7
1.5
-
-
1.0
1.0
ONGC
Neutral
172
-
220,154
83,111
84,934
44.2
44.9
16.4
16.9
10.5
10.2
1.3
1.2
-
-
2.5
2.5
Indian Oil Corp
Neutral
400
-
194,066
396,116
432,560
8.5
8.8
40.1
42.2
10.0
9.5
1.7
1.5
-
-
0.6
0.6
Reliance Industries
Neutral
819
-
532,791
257,711
267,438
17.0
18.2
89.1
89.5
9.2
9.2
0.9
0.8
-
-
1.7
1.6
Pharmaceuticals
Alembic Pharma
Buy
492
600
9,283
3,903
4,584
18.2
19.2
21.8
27.2
22.6
18.1
4.1
3.4
19.8
20.6
2.4
2.0
Alkem Laboratories Ltd
Accumulate
1,881
2,079
22,486
6,320
7,341
17.5
19.8
72.7
96.6
25.9
19.5
4.6
3.9
16.7
18.7
3.5
2.9
Aurobindo Pharma
Buy
709
823
41,510
17,086
19,478
22.1
22.0
44.7
51.4
15.9
13.8
3.5
2.8
24.7
22.7
2.5
2.2
Aventis*
Neutral
4,056
-
9,341
2,508
2,862
16.8
16.8
139.9
153.8
29.0
26.4
4.2
3.4
23.5
25.8
3.3
2.7
Cadila Healthcare
Reduce
474
426
48,556
11,584
13,228
20.3
20.4
18.7
21.3
25.4
22.3
5.7
4.6
24.6
22.9
4.0
3.5
Cipla
Sell
578
458
46,523
16,619
19,437
15.4
16.2
19.7
24.3
29.4
23.8
3.3
3.0
12.0
13.2
3.0
2.5
Dr Reddy's
Neutral
2,367
-
39,239
15,844
17,973
17.6
18.2
91.7
111.0
25.8
21.3
2.9
2.7
11.9
13.0
2.7
2.4
GSK Pharma*
Neutral
2,448
-
20,737
3,260
3,651
15.0
18.0
46.1
58.6
53.1
41.8
10.9
11.3
20.0
26.5
6.3
5.7
Indoco Remedies
Sell
206
153
1,900
1,154
1,310
14.9
14.9
11.3
12.7
18.2
16.2
2.6
2.3
15.0
15.0
1.8
1.5
Stock Watch
September 27, 2017
Company Name
Reco
CMP
Target
Mkt Cap
Sales ( Čcr )
OPM(%)
EPS (Č)
PER(x)
P/BV(x)
RoE(%)
EV/Sales(x)
(Č)
Price ( Č)
( Č cr )
FY18E FY19E
FY18E
FY19E
FY18E
FY19E
FY18E
FY19E
FY18E
FY19E
FY18E
FY19E
FY18E
FY19E
Pharmaceuticals
Ipca labs
Accumulate
511
540
6,450
3,593
4,022
14.5
15.5
19.4
25.2
26.4
20.3
2.4
2.2
9.5
11.2
1.9
1.7
Lupin
Buy
1,005
1,467
45,412
18,657
21,289
21.3
23.3
52.8
66.7
19.0
15.1
2.9
2.4
16.3
17.5
2.4
2.0
Natco Pharma
Neutral
786
-
13,695
1,836
1,946
31.8
28.9
22.1
20.6
35.5
38.1
7.1
6.4
20.1
16.7
7.3
6.9
Sun Pharma
Accumulate
507
558
121,750
32,899
36,451
26.9
25.4
31.6
32.3
16.1
15.7
2.8
2.5
18.7
18.8
3.3
2.8
Syngene International
Accumulate
500
557
10,005
1,402
1,823
32.8
36.0
15.9
20.7
31.5
24.2
5.9
4.8
18.7
20.0
7.1
5.5
Power
Tata Power
Neutral
80
-
21,625
32,547
33,806
20.5
20.5
4.7
5.4
17.0
14.9
1.6
1.4
10.5
10.5
1.7
1.6
NTPC
Neutral
167
-
137,576
86,070
101,246
28.3
30.7
12.9
16.2
12.9
10.3
1.3
1.2
10.6
12.4
3.0
2.7
Power Grid
Accumulate
211
223
110,256
29,183
32,946
89.7
90.0
18.0
20.8
11.7
10.1
2.0
1.7
17.7
18.2
7.7
7.2
Real Estate
Prestige Estate
Neutral
266
-
9,990
4,607
5,146
21.0
22.2
7.9
9.8
33.7
27.2
2.1
1.9
10.3
12.0
3.3
3.0
MLIFE
Accumulate
482
522
2,472
487
590
12.3
17.8
21.0
31.2
22.9
15.4
1.2
1.1
5.2
7.4
3.8
3.1
Telecom
Bharti Airtel
Neutral
387
-
154,819
97,903
105,233
36.0
36.3
9.3
11.1
41.7
35.1
2.0
1.9
5.0
5.6
2.5
2.3
Idea Cellular
Neutral
76
-
27,412
35,012
37,689
27.1
27.7
(4.4)
(2.7)
1.2
1.2
(6.8)
(4.6)
2.1
1.9
zOthers
Abbott India
Neutral
4,188
-
8,899
3,244
3,723
14.9
16.1
167.5
209.4
25.0
20.0
5.5
4.6
23.7
24.8
2.4
2.0
Asian Granito
Buy
476
570
1,432
1,169
1,286
12.5
12.5
16.0
19.7
29.8
24.2
3.2
2.8
10.7
11.6
1.5
1.3
Bajaj Electricals
Accumulate
359
395
3,640
4,646
5,301
6.7
7.6
16.1
22.3
22.3
16.1
3.6
3.1
16.4
19.2
0.8
0.7
Banco Products (India)
Neutral
209
-
1,497
1,530
1,695
13.2
12.7
19.0
20.0
11.0
10.5
1.8
1.6
0.2
0.2
0.9
98.5
Coffee Day Enterprises
Neutral
217
-
4,463
3,494
3,913
17.4
18.0
4.8
5.7
-
38.0
1.9
1.8
-
0.1
1.7
1.5
Ltd
Elecon Engineering
Neutral
55
-
613
171
201
15.0
16.2
36.0
43.0
1.5
1.3
0.1
0.1
0.1
0.1
3.0
2.5
Garware Wall Ropes
Neutral
853
-
1,865
928
1,003
15.2
15.2
39.4
43.2
21.6
19.8
3.6
3.1
16.5
15.4
1.9
1.7
Goodyear India*
Neutral
817
-
1,885
1,717
1,866
11.8
12.3
47.9
49.8
17.1
16.4
2.6
2.3
15.6
15.7
0.8
113.6
Hitachi
Neutral
1,882
-
5,118
2,355
2,715
10.3
10.8
49.0
60.9
38.4
30.9
9.0
7.1
0.2
0.2
2.2
1.9
HSIL
Neutral
389
-
2,811
2,240
2,670
14.6
15.0
17.0
22.0
22.9
17.7
1.9
1.8
0.1
0.1
1.5
1.2
Interglobe Aviation
Neutral
1,043
-
37,726
22,570
27,955
14.2
15.0
63.6
81.8
16.4
12.8
8.6
7.3
0.5
0.6
1.4
1.0
Jyothy Laboratories
Neutral
382
-
6,948
1,781
2,044
14.1
15.0
9.4
10.5
40.9
36.4
8.7
8.2
0.2
0.2
4.1
3.5
Linc Pen & Plastics
Neutral
225
-
333
420
462
9.3
9.3
15.3
17.1
14.7
13.2
2.5
2.6
16.9
19.5
0.8
0.8
M M Forgings
Neutral
643
-
776
542
642
20.1
21.0
41.6
56.8
15.5
11.3
2.1
1.8
0.1
0.2
1.8
1.6
Mirza International
Neutral
160
-
1,924
1,148
1,285
18.0
18.0
8.0
9.4
19.9
17.1
3.3
2.8
16.3
16.1
1.8
1.6
Navkar Corporation
Buy
186
265
2,653
561
617
41.5
41.5
11.5
12.7
16.2
14.6
1.7
1.5
10.5
10.4
5.4
4.7
Nilkamal
Neutral
1,551
-
2,314
2,317
2,525
11.4
11.1
96.0
105.0
16.2
14.8
2.7
2.4
0.2
0.2
1.0
0.9
Stock Watch
September 27, 2017
Company Name
Reco
CMP
Target Mkt Cap
Sales ( Čcr )
OPM(%)
EPS (Č)
PER(x)
P/BV(x)
RoE(%)
EV/Sales(x)
(Č)
Price ( Č)
( Č cr )
FY18E FY19E FY18E FY19E FY18E FY19E FY18E FY19E FY18E FY19E FY18E FY19E FY18E FY19E
zOthers
Parag Milk Foods
Neutral
239
-
2,010
1,987
2,379
7.6
9.0
12.4
18.3
19.3
13.1
2.7
2.4
8.2
13.2
1.1
1.0
Radico Khaitan
Neutral
158
-
2,102
1,811
1,992
13.2
13.2
8.1
8.8
19.5
17.9
2.0
2.2
10.1
12.0
1.5
1.4
Relaxo Footwears
Neutral
505
-
6,068
1,981
2,310
13.7
14.5
12.0
15.5
42.1
32.6
8.2
6.6
0.2
0.2
3.1
2.7
Siyaram Silk Mills
Buy
2,152
2,500
2,018
1,769
1,981
12.7
12.7
113.1
131.1
19.0
16.4
2.9
2.5
15.5
15.5
1.3
1.2
Styrolution ABS India* Neutral
852
-
1,498
1,800
1,980
8.0
8.1
42.0
46.2
20.3
18.4
2.3
2.0
0.1
0.1
0.9
0.9
Surya Roshni
Neutral
306
-
1,342
4,870
5,320
7.7
7.8
22.8
28.1
13.5
10.9
1.8
1.5
0.1
0.1
0.5
0.4
TVS Srichakra
Neutral
3,192
-
2,444
2,729
2,893
12.7
12.5
248.5
265.0
12.8
12.0
3.6
3.0
0.3
0.3
0.9
0.8
Visaka Industries
Neutral
597
-
948
1,104
1,214
12.1
12.6
31.0
37.9
19.3
15.8
2.3
2.1
0.1
0.1
1.1
1.0
VIP Industries
Buy
246
300
3,471
1,450
1,693
10.4
10.5
6.5
7.8
37.5
31.4
7.9
6.9
21.1
22.1
2.4
2.0
Navin Fluorine
Accumulate
662
730
3,262
945
1,154
22.4
22.6
28.7
34.8
23.1
19.0
3.8
3.3
-
-
3.0
2.3
Source: Company, Angel Research; Note: *December year end; #September year end; &October year end; Price as on September 26, 2017
Market Outlook
September 27, 2017
Research Team Tel: 022 - 39357800
DISCLAIMER
Angel Broking Private Limited (hereinafter referred to as “Angel”) is a registered Member of National Stock Exchange of India
Limited,Bombay Stock Exchange Limited and Metropolitan Stock Exchange Limited. It is also registered as a Depository Participant with
CDSL and Portfolio Manager with SEBI. It also has registration with AMFI as a Mutual Fund Distributor. Angel Broking Private Limited is a
registered entity with SEBI for Research Analyst in terms of SEBI (Research Analyst) Regulations, 2014 vide registration number
INH000000164. Angel or its associates has not been debarred/ suspended by SEBI or any other regulatory authority for accessing
/dealing in securities Market. Angel or its associates/analyst has not received any compensation / managed or
co-managed public offering of securities of the company covered by Analyst during the past twelve months.
This document is solely for the personal information of the recipient, and must not be singularly used as the basis of any investment
decision. Nothing in this document should be construed as investment or financial advice. Each recipient of this document should make
such investigations as they deem necessary to arrive at an independent evaluation of an investment in the securities of the companies
referred to in this document (including the merits and risks involved), and should consult their own advisors to determine the merits and
risks of such an investment.
Reports based on technical and derivative analysis center on studying charts of a stock's price movement, outstanding positions and
trading volume, as opposed to focusing on a company's fundamentals and, as such, may not match with a report on a company's
fundamentals. Investors are advised to refer the Fundamental and Technical Research Reports available on our website to evaluate the
contrary view, if any.
The information in this document has been printed on the basis of publicly available information, internal data and other reliable
sources believed to be true, but we do not represent that it is accurate or complete and it should not be relied on as such, as this
document is for general guidance only. Angel Broking Pvt. Limited or any of its affiliates/ group companies shall not be in any way
responsible for any loss or damage that may arise to any person from any inadvertent error in the information contained in this report.
Angel Broking Pvt. Limited has not independently verified all the information contained within this document. Accordingly, we cannot
testify, nor make any representation or warranty, express or implied, to the accuracy, contents or data contained within this document.
While Angel Broking Pvt. Limited endeavors to update on a reasonable basis the information discussed in this material, there may be
regulatory, compliance, or other reasons that prevent us from doing so.
This document is being supplied to you solely for your information, and its contents, information or data may not be reproduced,
redistributed or passed on, directly or indirectly.
Neither Angel Broking Pvt. Limited, nor its directors, employees or affiliates shall be liable for any loss or damage that may arise from
or in connection with the use of this information.